
Whole-building envelope surveys
The whole envelope, located and measured.
- Envelope testing and inspection firms
- Envelope and engineering consultancies
- Independent thermographers
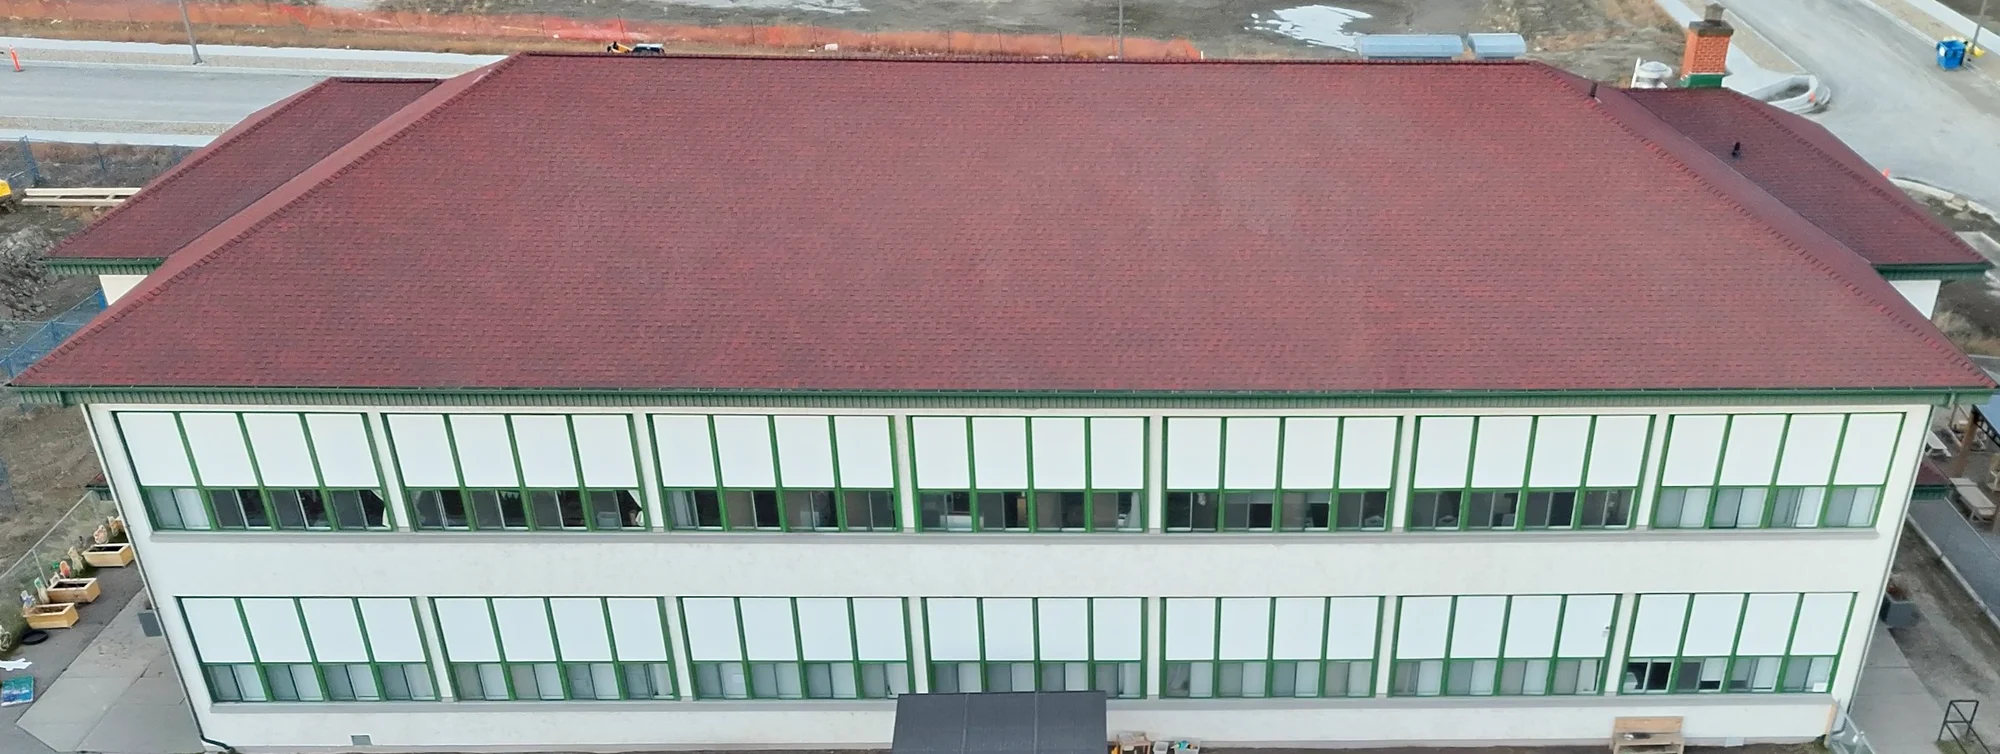
What your team gets.
- 01
Every anomaly located and sized
Coordinates, length, width and area, ready to find on site and mark on a drawing.
- 02
The whole visible exterior in one record
Roofs, walls, parapets and upper floors in one flight and one 3D view, with less need for lifts or rope access.
- 03
Checked against every photograph that saw it
Anomalies that hold up are listed and the rest set aside. Every reading traces to the pixel of its source photograph, and original files are fingerprinted on arrival.
- 04
Reviewed in a browser, exported to your drawings
Nothing to install. Mark each anomaly, open its photographs and export DXF outlines, or E57 or LAS points.
- 05
What an exterior survey cannot tell you
Where a surface reads warmer or cooler, not why. Cladding hides what is behind it, and glass and metal reflect. Your team confirms on site.
The draft report.
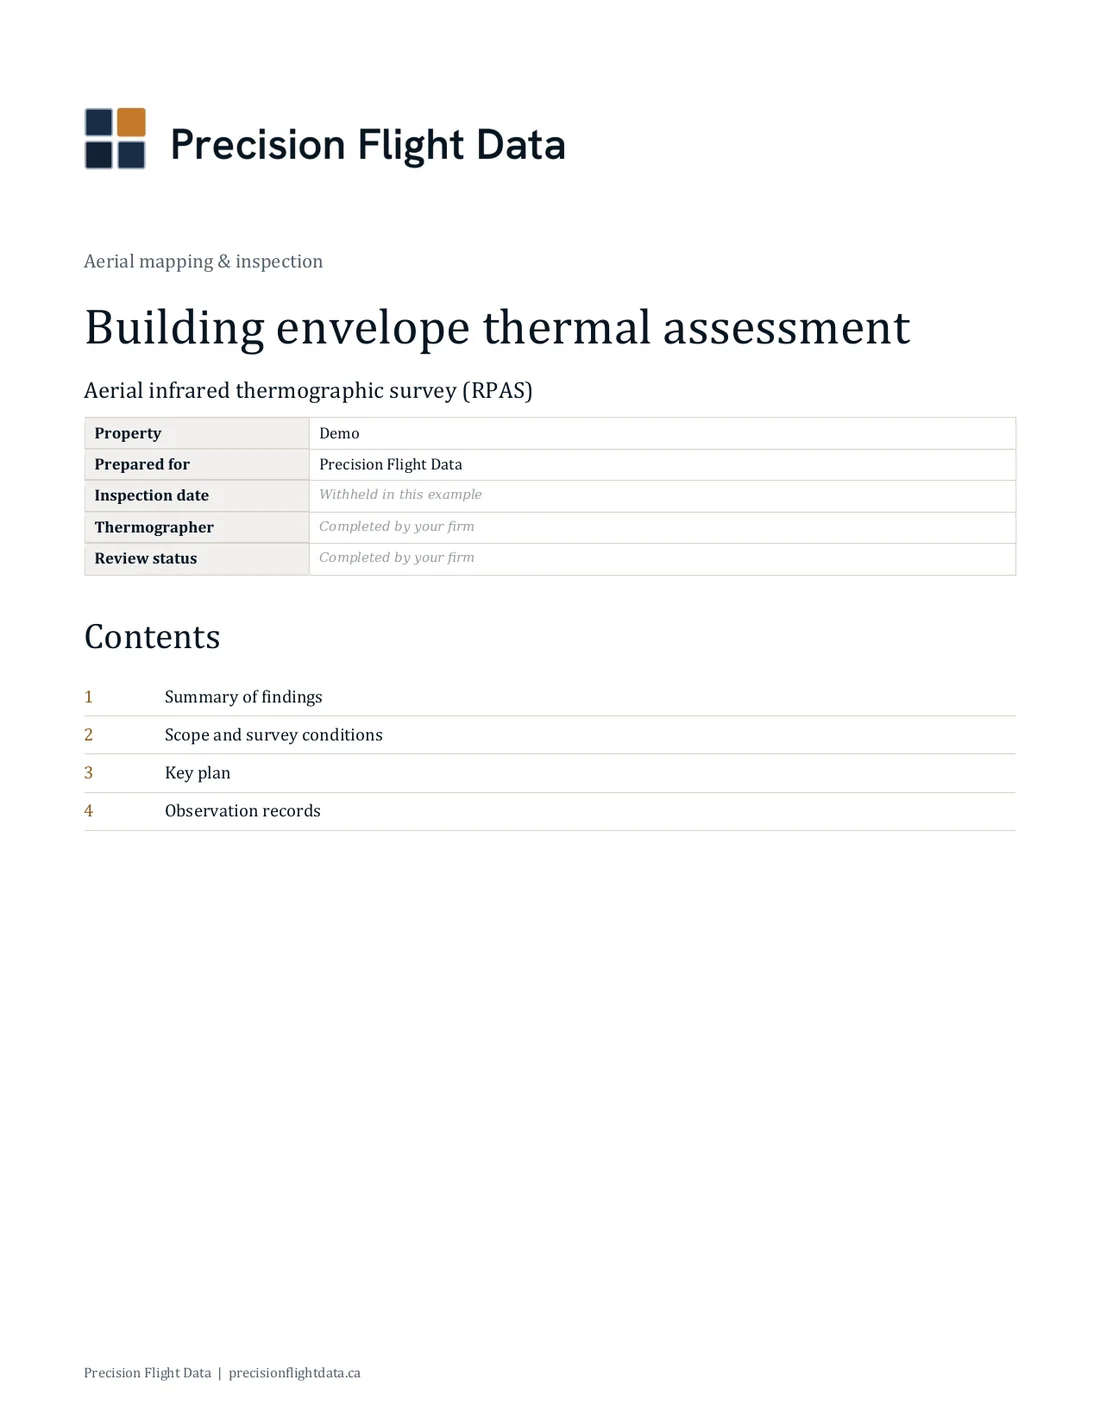
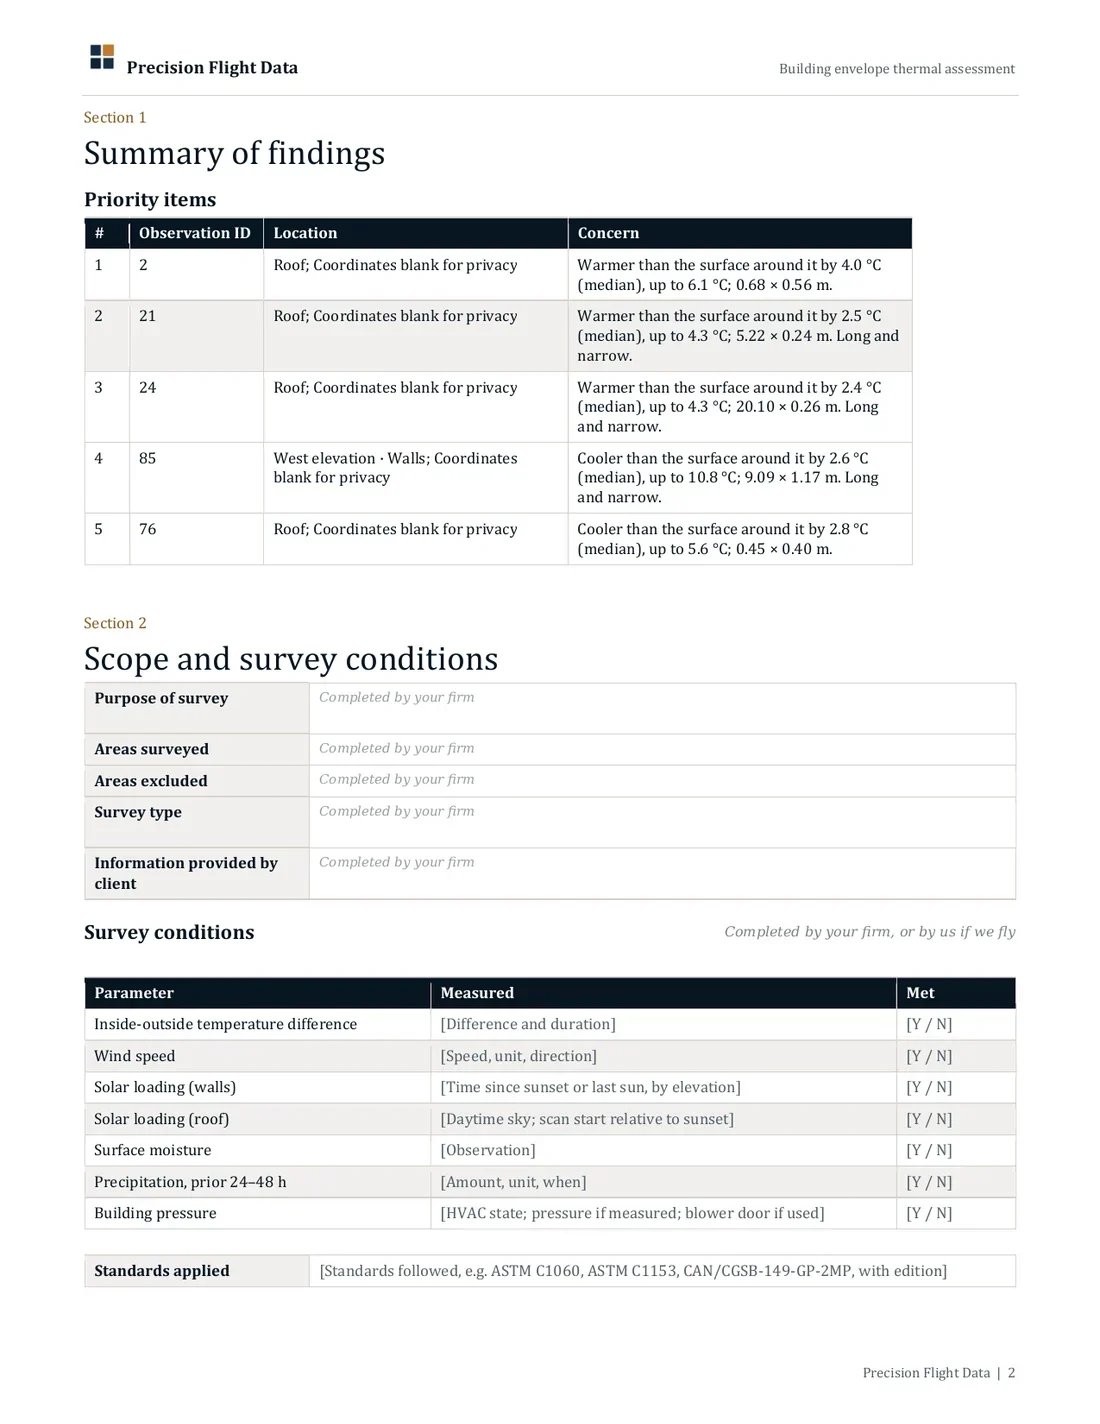
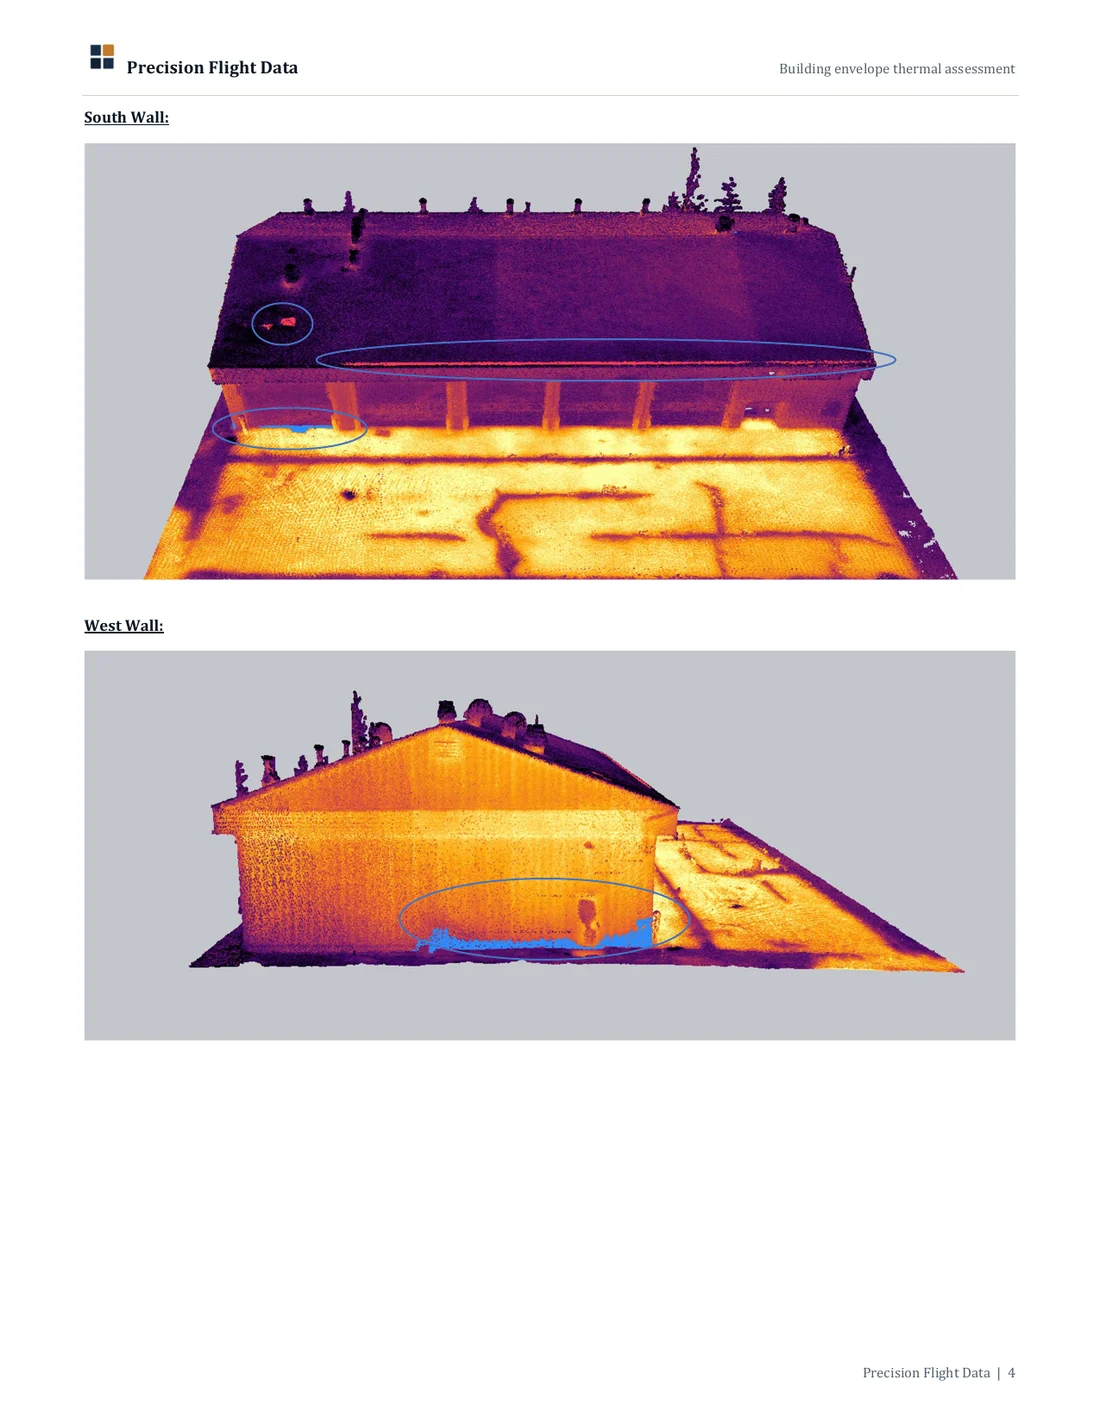
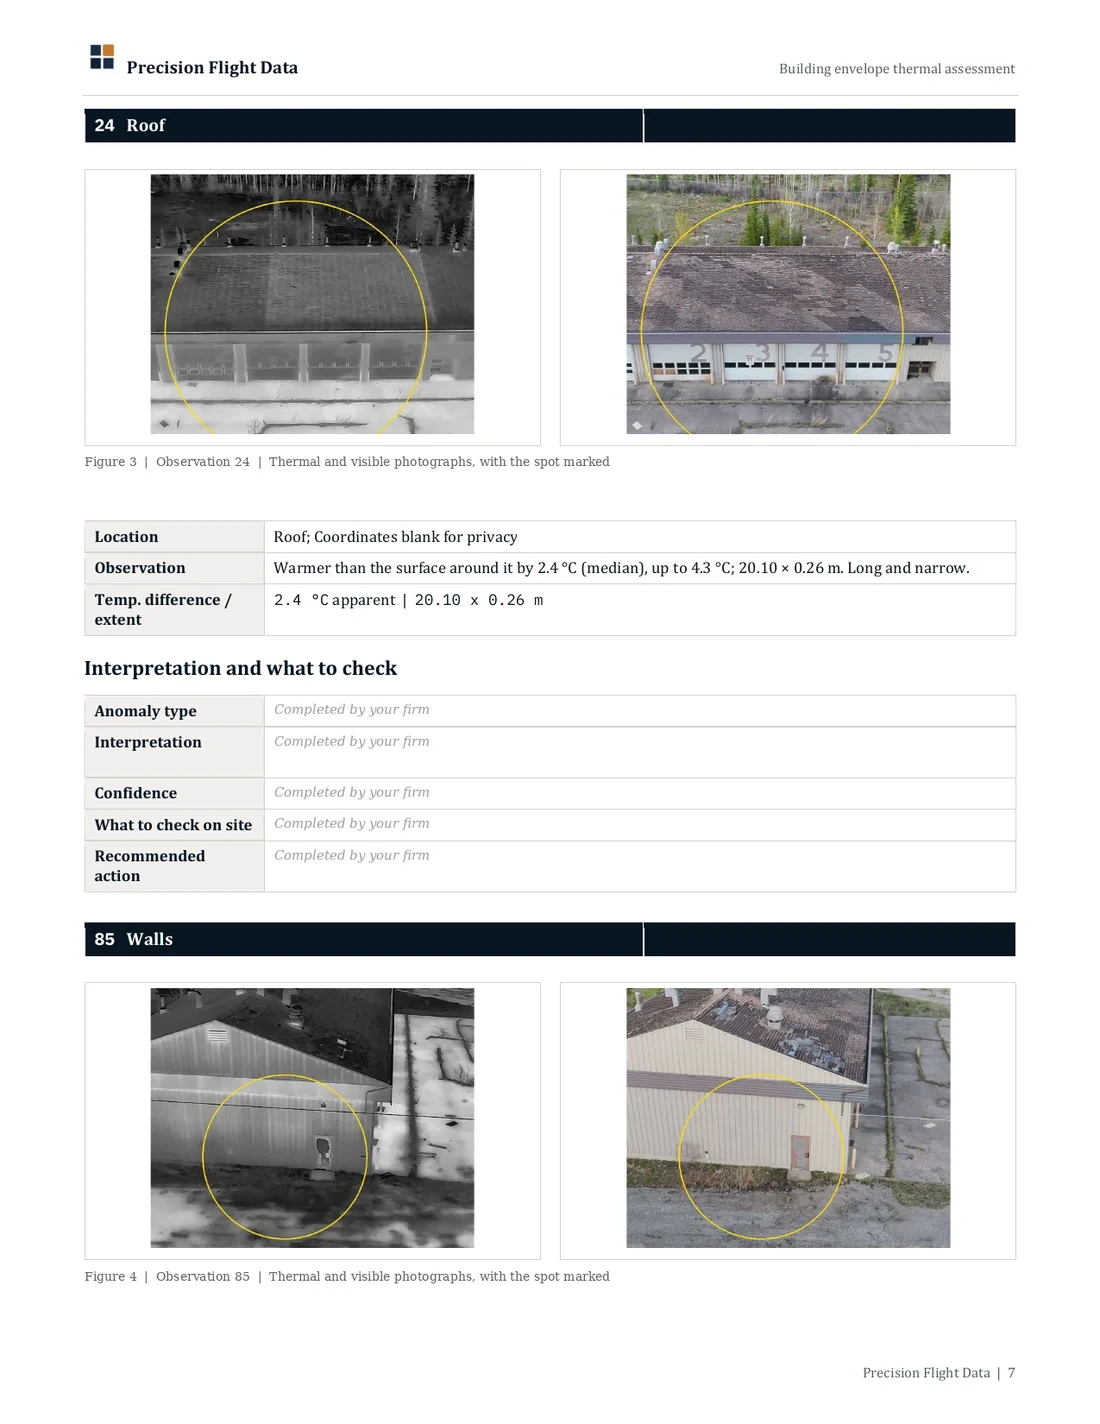
A draft assessment report: priority items, key plans and an observation record for each anomaly. Interpretation and sign-off stay with your firm.
From a first project.
A client's building, flown in November 2026. Not the example building in the live demo.
- 01
634 thermal photographs
Taken from the air after sunset, in about 20 minutes of flying.
- 02
151 million temperature readings
Each placed on the building in 3D, at full density.
- 03
434 spots narrowed down to 15 anomalies
Every flagged spot is checked against the individual photographs that saw it. Your team reviews the 15 that need attention, made up of 29 spots, not all 434.
Planning a flight? See the capture guide for building envelopes.
Next step
Ready to start?
Tell me about the building and the survey you have in mind. I check that the capture is suitable, then scope and price a pilot before anything starts.